Getting it right when hosting Tableau on AWS
Four days to create a publicly available data dashboard

The challenge
Objective
Create a data dashboard with vast amounts of data that needed to be accessible and understandable for both the public and organisations to use in four days.
Outcome
We used Tableau on Amazon Web Services (AWS) to visualise the dataset in this very tight resulting in visualisations that are available for both the public and organisations to use.
Results that matter
The architecture underpins everything else, and one of the benefits of using Tableau server for this project which means we were able to deliver it right first time.
The brief
Getting it right when hosting Tableau on AWS
We had just four days to create a data dashboard with vast amounts of data that needed to be accessible and understandable for both the public and organisations to use.
Speed was of the essence with this job, so cloud-based computing was the only way to achieve this deadline. We used Tableau on Amazon Web Services (AWS) to visualise the dataset in this very tight resulting in visualisations that are available for both the public and organisations to use.
We found that there’s not a great deal of knowledge about how to set up and run a Tableau Server on AWS – or indeed another cloud provider – beyond the basics. It’s not difficult to set up a default installation or even a high-availability cluster, but there are some quirks to be aware of and it’s better to plan as much as possible up front.
Architecture
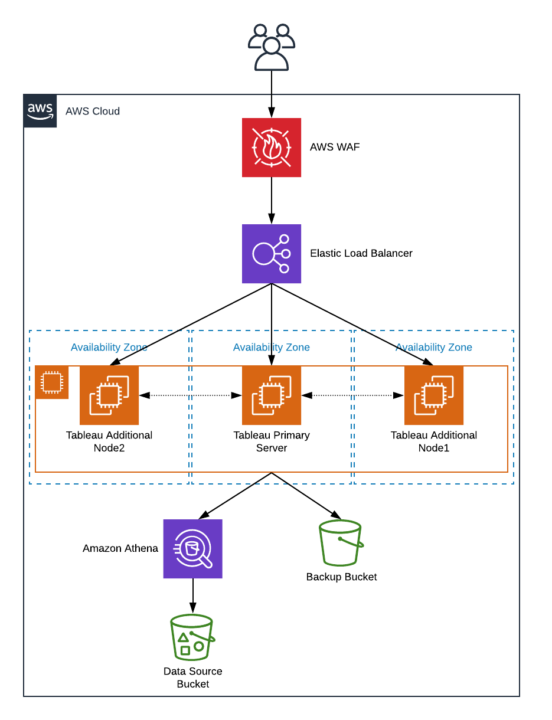
Let’s take a look at the architecture
The architecture underpins everything else, and one of the benefits of using Tableau server for this project which means we were able to deliver it right first time.
Our chosen architecture allows for future scaling and balances the best of high availability through multiple AWS Availability Zones. Here’s an outline of the architecture we used for this job:
- Secure by design – used an AWS Web Application Firewall (AWS WAF) to protect against attacks
- Used Tableau’s recommended elastic load balancer in front of server nodes, which is simple to set up in AWS
- Implemented simple monitoring to avoid redirecting to nodes that are down
- Used three EC2 instances: the Tableau Primary Server and two additional nodes
- Amazon S3 to source the existing data for our dashboards and Amazon Athena to create a database that Tableau can use
- Amazon S3 to store Tableau backups and to log file snapshots, both of which can be large

Things we learnt along the way
We’ll caveat this by saying this: the advice offered here is anecdotal and based on our experience.
We felt that Tableau works well for larger projects as their team can offer support in determining cluster size, deployment assistance and for using data sources. However, Tableau is a large installation with a number of post-install steps to complete.
What level of demand are you expecting?
A single 8-core installation will support around 50 concurrent users with a moderately complex dashboard and in-memory data source. We would suggest running three 8-core servers for any serious production or public facing workloads.
Tableau server licensing
The server licence covers the total number of cores in your installation. For example, if you are deploying three 8-core servers as a cluster, you’ll need a 24-core licence. The simplest licence, and the one offered on new installations, is priced per core.
Configuration requires a restart
A whole cluster needs to be restarted to make any server level configuration changes. This can take about ten minutes for simple changes and longer for changes to the cluster topology. Any down time is less than ideal so this is why we really recommend planning your architecture thoroughly in advance.
Your data source
Tableau supports many different data sources depending on what kind of data you’re sourcing – whether that’s extracts, daily snapshots, real time feeds, or traditional SQL databases. You could even reuse your existing legacy database. However, it’s important to consider how Tableau will connect to any on-premise or heavily protected databases and how your data science team may publish data to AWS in your account.
To make this deployment as cloud native as possible we used Amazon S3 and Amazon Athena for the data source. Athena simply converts source data in a flat file format into a relational database Tableau can use.
Results that matter
Running Tableau on AWS provided us with the speed we needed for a very urgent project. We were able to produce a data dashboard using vast datasets that are now accessible to thousands of daily users.
AWS provides the speed and security we’ve come to expect from cloud-computing.
We can help you
If you’re interested in using Amazon Web Services or Tableau or how data architecture can help you deliver it right, we’ll be happy to help.
Written by Jamie Whittingham, DevOps Consultant