Building a knowledge graph
Getting more insight and value from a business’s data, for example through machine learning, first requires a considered view of the data estate. An increasingly popular method is to build a knowledge graph of all data assets in the business.

Data Inventory
In order to develop a graph view over a data estate, we need to determine what it will cover, and by performing a data inventory, we can determine: (a) what data is available; (b) how often it updates; (3) who is responsible for it; and (4) is it all online/in the cloud.
This overview enables us to know what the data covers, and begin to develop a reference architecture for capture of the data, and build up relationships with the data owners.
Semantic Data Modelling
One of the most crucial aspects of building a knowledge graph is to establish a holistic view of the data to enable the linking of information from different siloes. This can be performed in a number of ways; the most straightforward starting point is to develop an upper ontology of the major shared “nouns” across the business, such as people, projects, accounts, orders etc. This upper ontology provides a shared vocabulary for each data source, and some of the relationships between them at a high level.
For each domain vertical it can be appropriate to devolve domain-expertise by distributing responsibility to information architects within each subject area. By inheriting from the upper-level enterprise ontology, connections between business areas are maintained, while still retaining core domain knowledge within verticals.
While developing ontologies, it is key to re-use or link with concepts from open ontologies used by data publishers. Examples include FIBO (Financial Industry Business Ontology), Schema.org, Good Relations, and FIRO (Financial Industry Regulatory Ontology). These ontologies describe business areas in detail, which can be beneficial to re-use rather than develop again, and accelerates integration with published data, by using these ontologies as data integration points.
Architecting Data Capture
Building on the data inventory, we can begin to develop an architecture to capture data from the relevant systems of record, based on the five V’s of big data:
- Volume: the size of the data
- Variety: the formats and data models
- Velocity: how often the data updates
- Veracity: how trustworthy the data is
- Value: the importance of this data
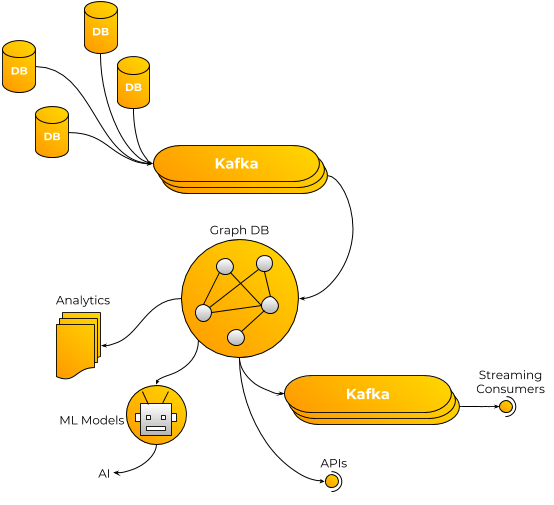
By measuring data against these aspects we can determine the best fit approaches to data collection. For example, for a high velocity data source it may be appropriate to deploy Kafka queues for ingest, whereas a low veracity data source may need a pre-processing validation stage before use in a graph.
Graph Database
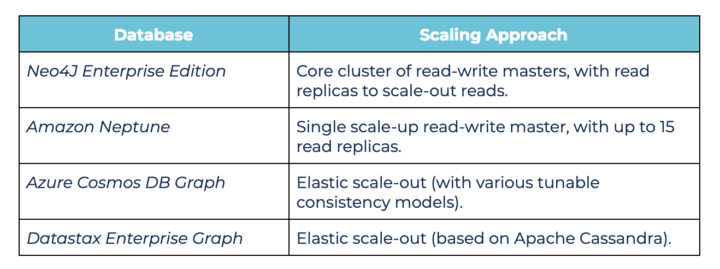
Select a graph database that is suitable for your data requirements, with respect to the scale of ingest, size of the data and the expected level of queries. As with other databases systems, there are different approaches to graph database scaling that enable them to either scale-up or scale-out, for example, the most popular graph databases:

The cloud or on-premise platform that is to be used will also affect which graph databases are available – e.g. Neptune is only available on AWS, while Cosmos DB can only be used on Azure. There is also the complex issue of pricing the deployment, where one has to take into account the price of license (if applicable), the sizing of the individual database nodes, and the number of nodes. Cloud providers provide pricing calculators to aid in this task, and a data architect can compare the per-node and per-cluster costs based on your expected workload.
Using your Knowledge Graph
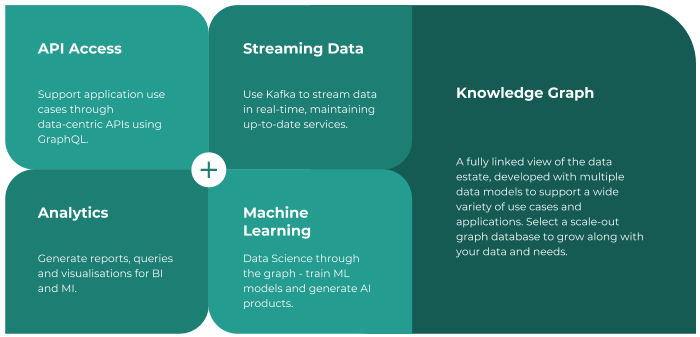
There are a rich set of use cases supported by knowledge graphs:

API Access
Accessing the knowledge graph directly using simple searches and queries aids development of applications that need to use data from multiple sources. Having a single view over the business’s data estate enables rapid development of new applications. Designing the API to enable agile use of this data is therefore critical to unlocking this value. One of the best ways to achieve this is to design a “data-centric API” where the caller specifies the data they would like, rather than designing an API for specific use cases.
Consider using a GraphQL API for the knowledge graph – GraphQL is a data-centric API where the graph information model can be flattened to JSON on a per-query basis, so that non-graph applications can query the graph in a familiar and powerful way. For more information on GraphQL, see: https://graphql.org/
Depending on your use cases, it may also be necessary to create APIs specifically for other use cases. Most common are for Analytics and for Machine Learning (ML) training sets: bringing together enterprise datasets is useful for analytical workloads, while ML training data often crosses business unit boundaries.
Streaming Data
Architecting the graph ingest using Kafka streaming removes bottlenecks of batch ingestion stages, and keeps the graph up-to-date in real-time. There are use cases where continuous querying of graph can be beneficial, for example in fraud detection or watchlist generation. In these cases, we can use smart ingest queue monitors to optimise continuous queries when graphs update, and output new results to consumer streams.
Analytics
Given that a knowledge graph represents a fully linked considered view of a business’s data, it is therefore a rich source of data for a BI/MI system. The work to gather and link data is abstracted into the graph, and the BI/MI architecture can be simplified to consume from the graph. As such, a knowledge graph plays a central role in generating reports, performing analytics queries, and feeding visualisations. It can also be a rich source for modern AI-based search solutions, which tap into thousands of business dimensions at once to show hotspots and outliers that matter.
Machine Learning
It is said that 90% of a data scientist’s day is concerned with data gathering, linking and cleaning. Much of these tasks are performed by the graph processors, and therefore allow data scientists to explore data, query the graph, and reduce the data scientists’ workload of cleaning and linking data.
We can also use the graph for updating machine learning training sets and models – a key aim of machine learning in business is to predict the aspects that affect business growth and departmental KPIs. A knowledge graph that spans business units is a key input source for machine learning models.

At 6point6 we have in-depth experience delivering graph database solutions for our clients, and maintaining them using our DataOps methodology.
Written by Dr. Daniel Alexander Smith, Lead Big Data Architect